Image may be NSFW.
Clik here to view.
Clik here to view.

I like geographic data, and in recent years developed a simple tool to easily visualize all of my Google location history data in a single zoomable and interactive map. It converts your complete Google location history data for use in a Google Fusion Table. You can customize the visualization to your own preference in the map settings. In order to hide artifacts in the GPS data the code splits movement when locations are too far apart. You can see a screenshot of my map below, which visualises six years of location history data with 1.4 million points.
Image may be NSFW.
Clik here to view.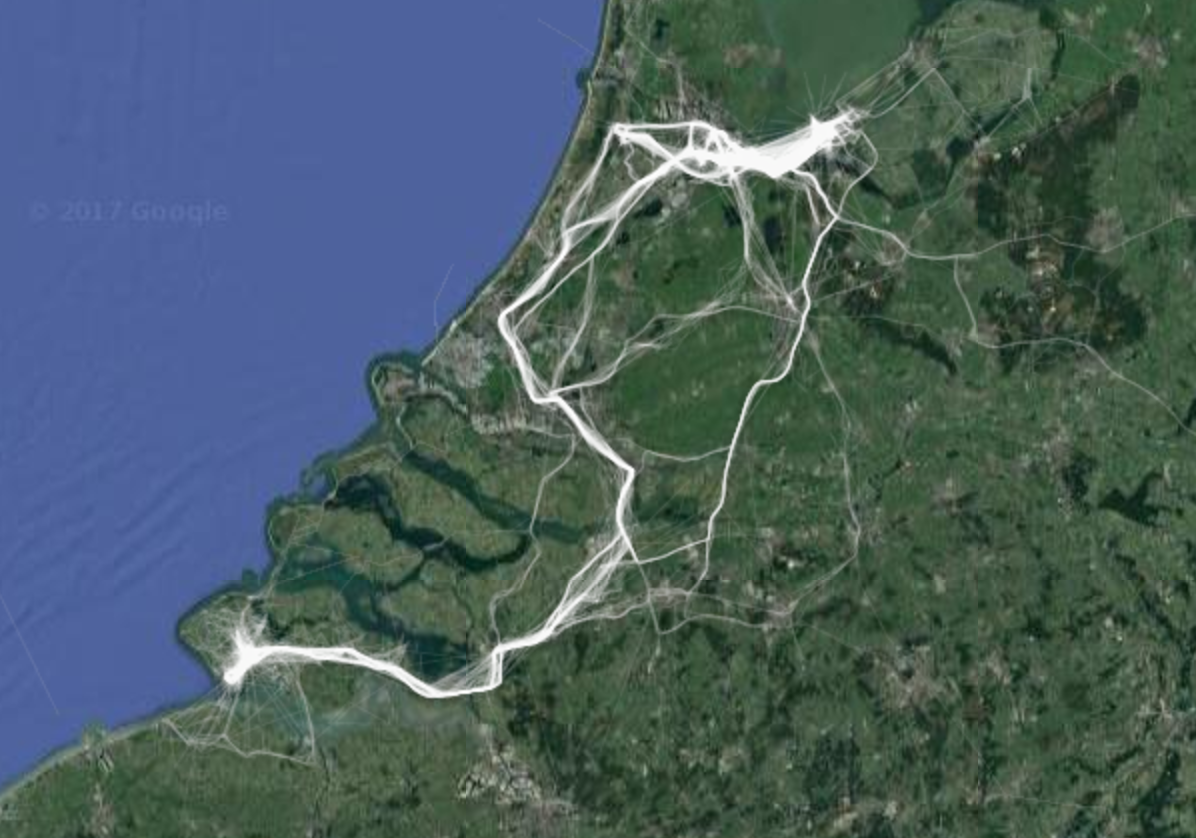
Instructions
In order to visualize your own location history, download the code repository on github and follow these steps:
- Download your location history in JSON format via Google Takeout
- Extract the JSON file and configure its location in generate.py
- Run generate.py using Python 2.7 and your location history will be transformed into a CSV file with connected coordinates
- Create a new Fusion Table in Google Drive and upload your history.csv file
- Go to the map tab to view your location history. Change the feature styles such as Line Color to an opacity of 5% to 10%
- Change the map to terrain view to improve visibility. You can share the map via Tools -> Publish
